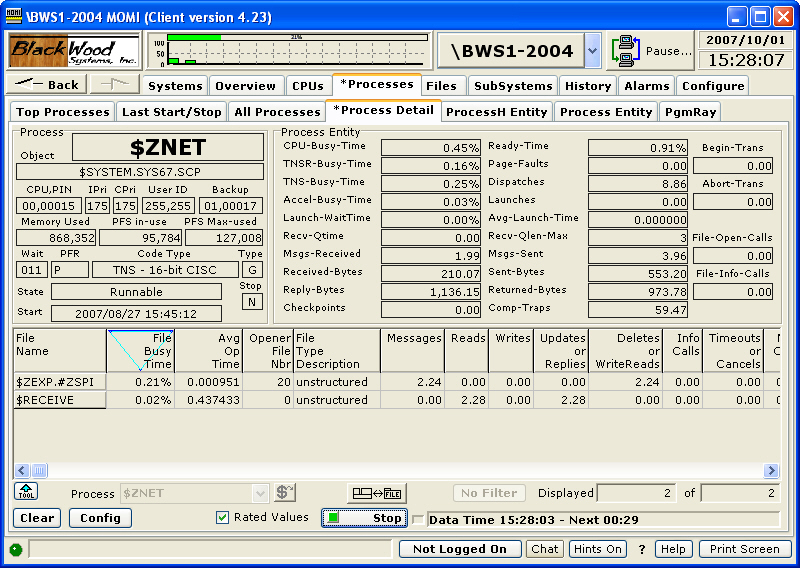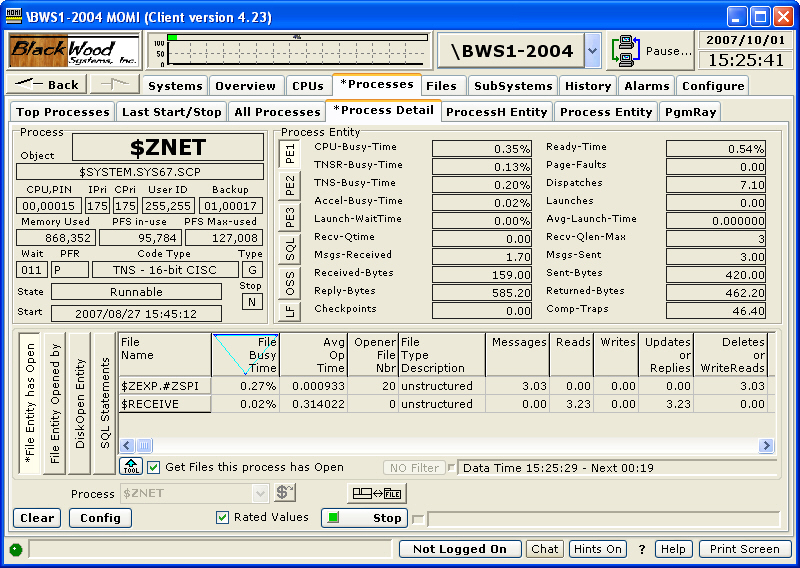

The Processes / Process Detail screen presents a comprehensive look into a process.
Click on the areas in the image above display additional information.
The screen presents resources consumed, files opened by the process, files opened to the process, and SQL Statements activity. The SQL Statements section is not activated by default.
Information on this screen is obtained via Guardian procedure calls and the MEASURE entities of Process, File, DiskOpen, SQL Process and SQL Statement.
Values by default are rated in a "Per Second" mode such as 1.40 Comp-Traps. Uncheck the Rated box causes raw values to display. The window of time for the Process Entity is visible by pushing the Page 3 button. The window of time for the File, DiskOpen and SQL Statements entities are visible by scrolling all the way over to the right.
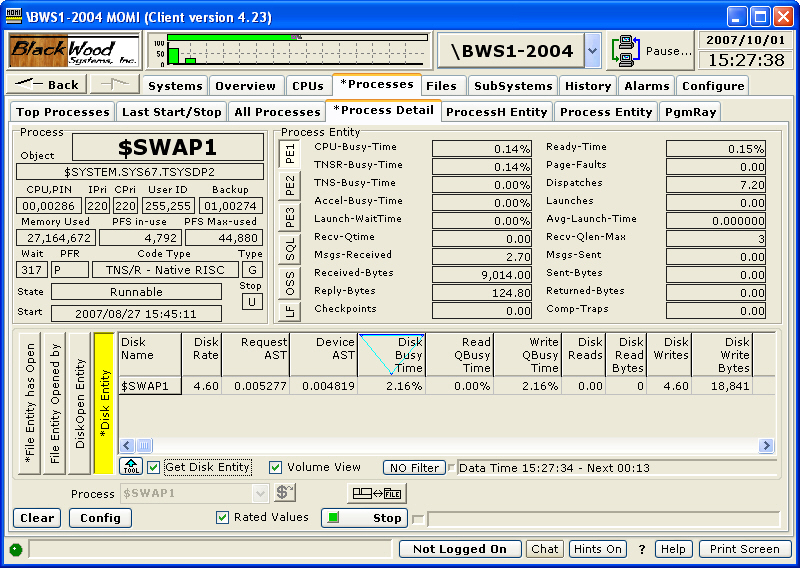
A Disk process displays similar information except the SQL Statements button is replaced by the Disk Entity.
The operation of the screen may be altered by the Config button:
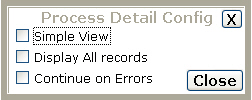
The Simple View will reduce or 'down size' the amount of information presented. By Default, records in the File, DiskOpen and SQL Statements do not display records with zero values (i.e. open but not active).
The Display All records option allows zero value records to be displayed.
The Continue on Errors option causes the screen to continue gathering data even when the process being measured has stopped (i.e. the display of data automatically picks back up again if the process is restarted). This is useful for transient processes or during debugging sessions.
Below is a sample screen for the Simple View selection:
