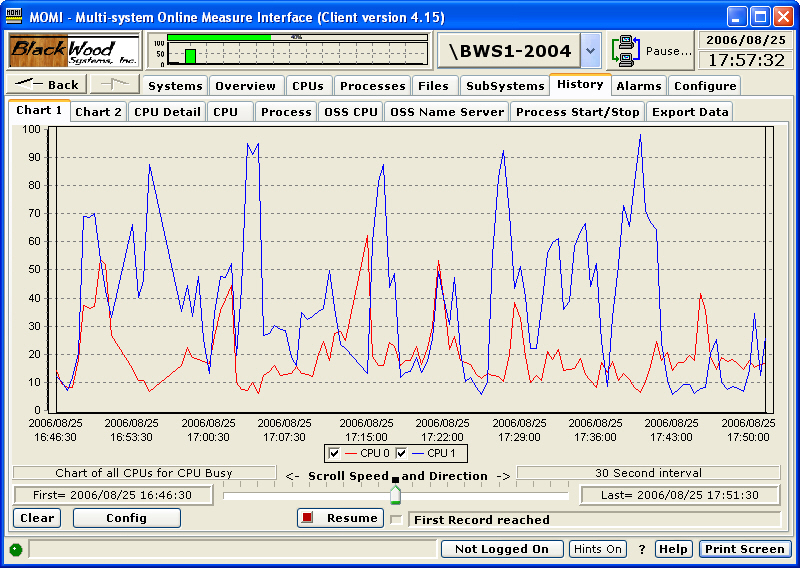

The History / Chart 1 screen presents User-selected data from the MOMI history files.
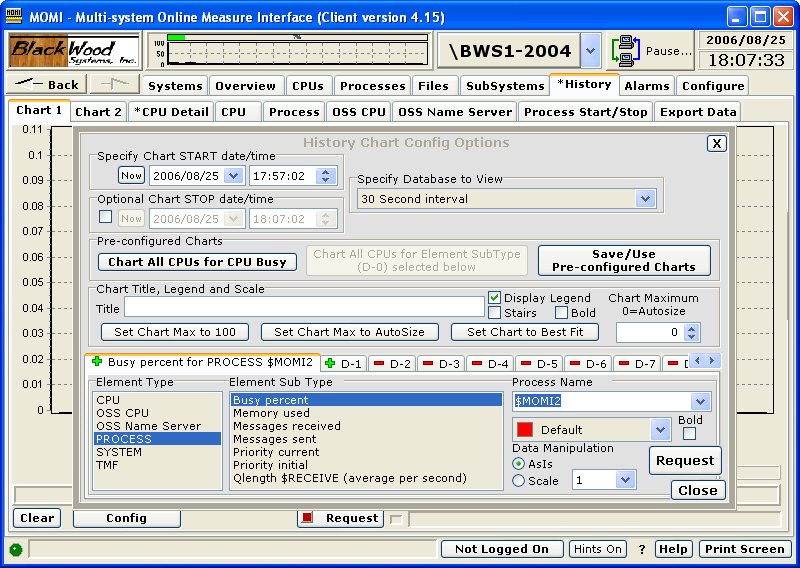
History to be charted is selected from the Config pop-up screen. Start time, History database and item are selected. Up to 16 different history items may be selected. When an Element Type is selected, the available items appear in the Element Sub Type. Additional information may be required in the Element ID. For example, selecting a Process Element Type requires a process name (or cpu,pin for unnamed processes) in the Element ID.
The "Chart All CPUs for CPU Busy" is a built-in selection.
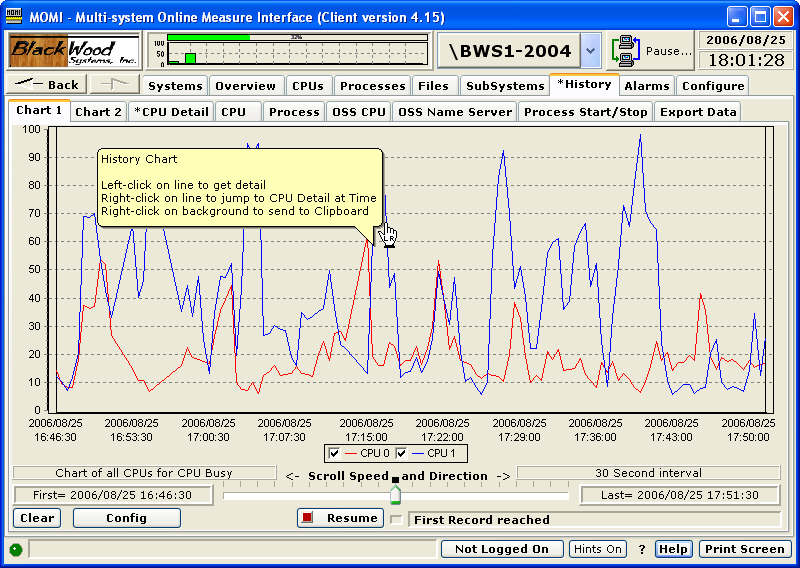
Additional information and drill down options are available; place the mouse over a chart line.
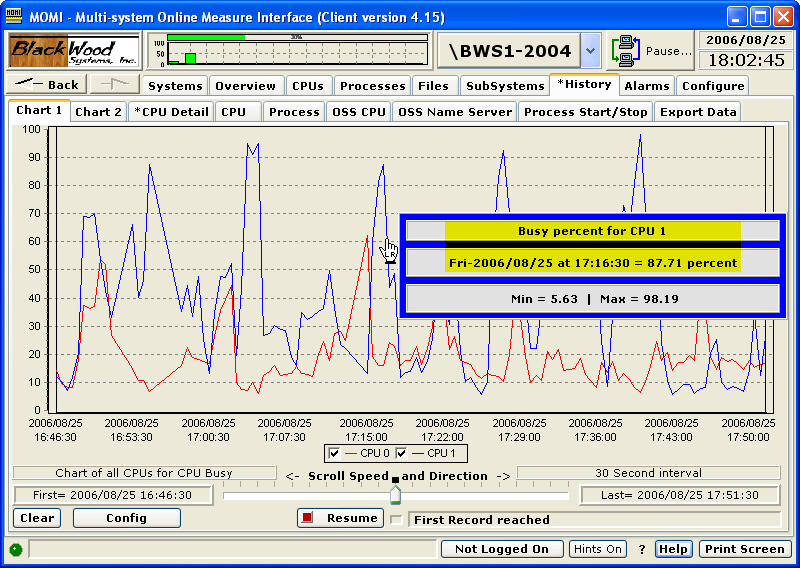
Clicking on a chart line will display the date/time and exact value at the point as well as the minimum and maximum values present on the screen for that line.
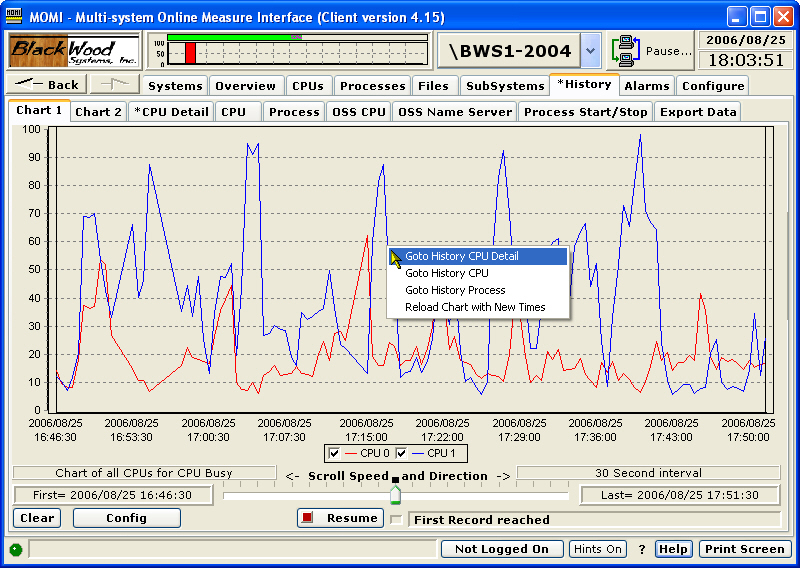
Right-clicking over a line will bring up a menu to allow 1) drill-down of that CPU and its processes, 2) display of all CPUs, 3) display of all processes or 4) bring up the Config screen and reload the chart with a New Time.
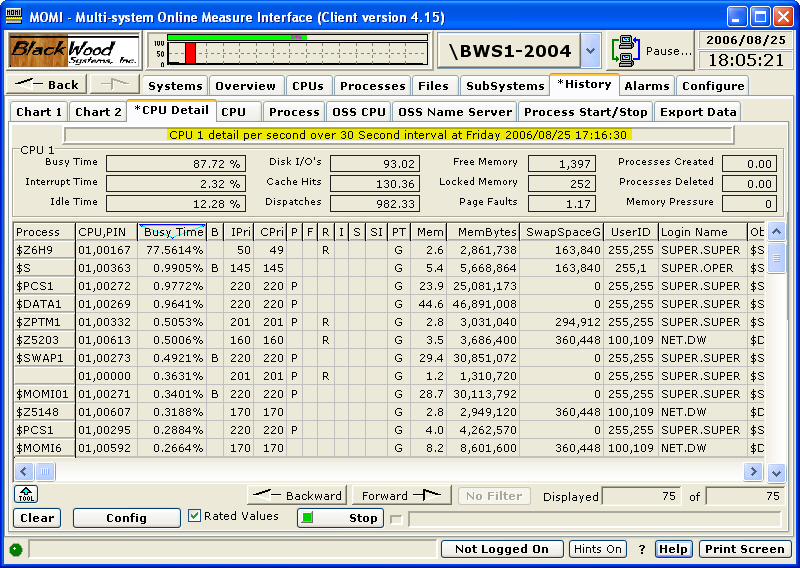
History CPU Detail selection jumps to the History / CPU Detail screen to display selected CPU information and all processes at that point in time. The Backward and Forward button allow stepping at the history interval.
The display of some entities, for example a Process, require additional information. In the picture below, after PROCESS and Busy percent is selected, the Element ID field is enabled (in this example the process name $MOMI2 is entered).
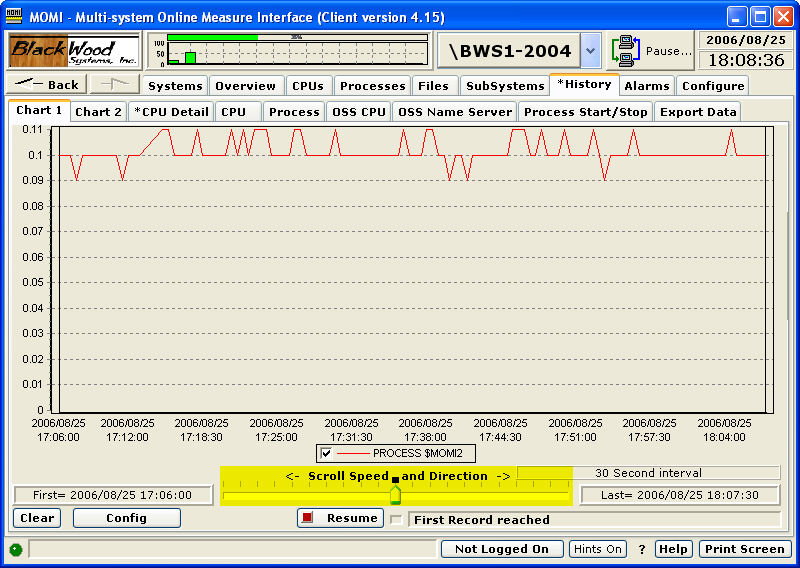
The scrolling feature in history provides the ability to look before and/or after a point in time. This powerful feature allows the User to easily scroll forward and backward in time and visually search for unexpected activities.
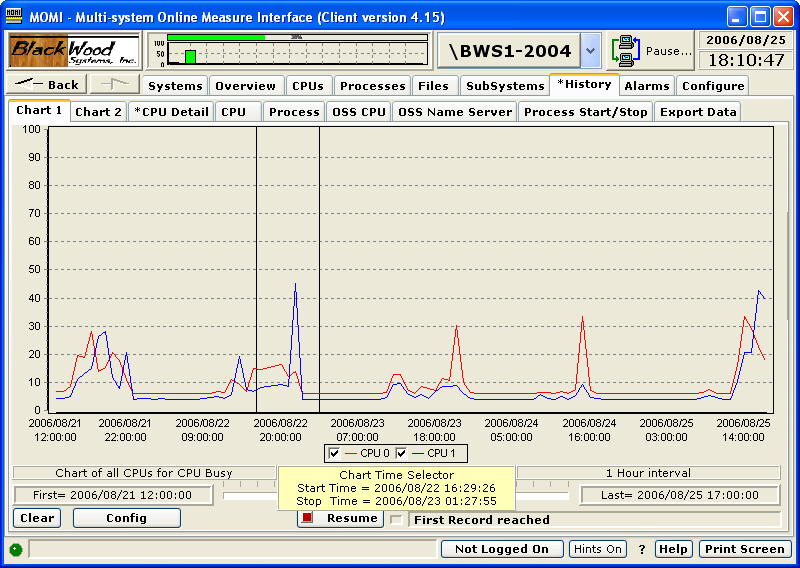
History drill-down is aided by two bars (highlighted in green) on the left and right hand sides of the chart. They provide a graphical means to select a select a window of time based on the current data displayed. In the image below, history at 1 hour is displayed.
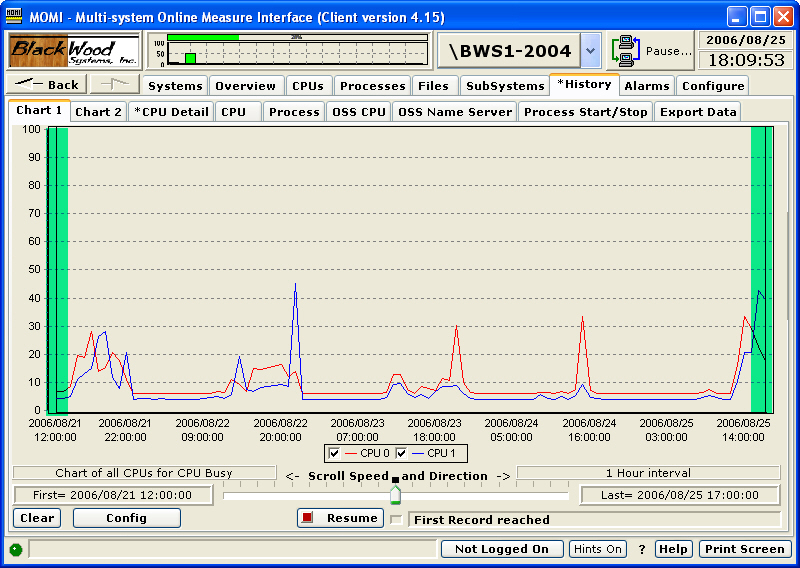
Left-click and hold on a line to move it left and right. A pop-up tool tip appears in the bottom center to show the current time values with the history bar selection. In this example, the scroll bars are moved to just either side of a 'bump' in the history chart graph data.
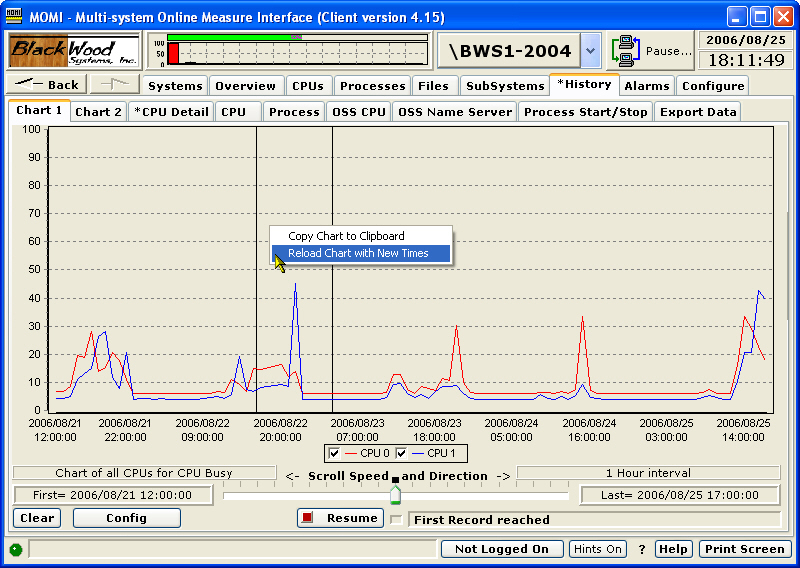
After the bars are positioned, right click on the chart area and select "Reload Chart with New Times".
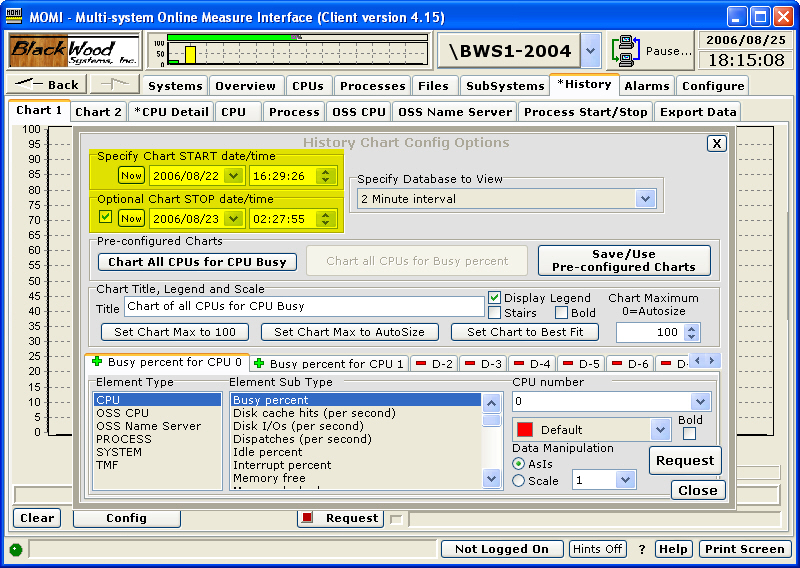
The History Chart Config Options pop-up window is displayed. Note that the Chart START and STOP times are pre-loaded with the values displayed when the history bars were positioned. Additionally, the History database was pre-selected to the next higher resolution. Press Request to reload the chart based on the new time values and selected database.
The screen is reloaded with the times selected (perhaps adjusted to the capture interval).
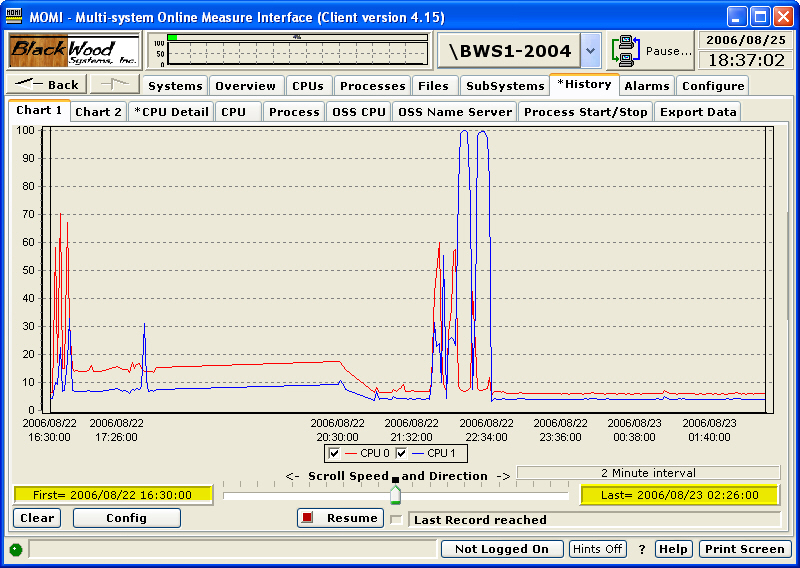
Further history drill-down can occur until the highest resolution data is reached (assuming the history is still available). Available history may be see on Server / Server Info 5.