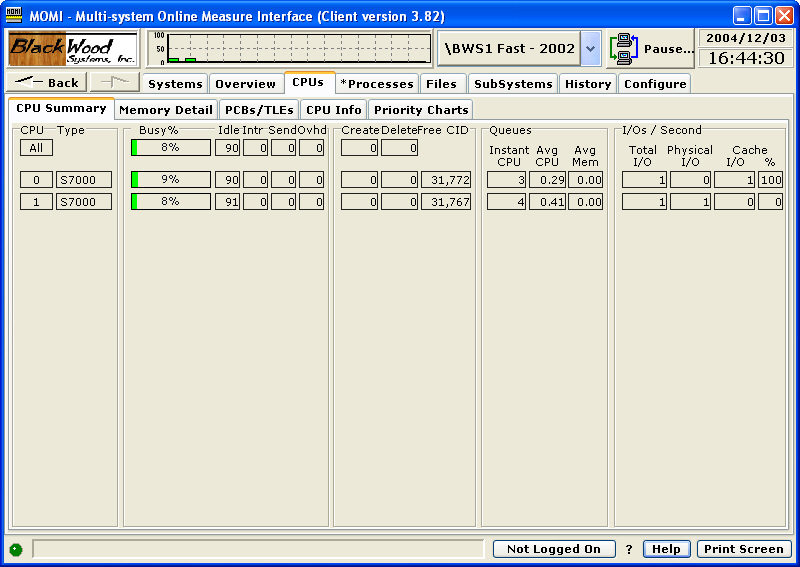
The CPUs / CPU Summary screen provides high level detail on the activity of each processor in the System.
Busy % breaks down the total CPU busy value into Interrupts, Send and Overhead. Send busy time is not found on newer ServerNet processors, only on older platforms.
Processes created and deleted give an indication as to the level of process turnover on the System. Typical Guardian-based processes usually start and stay started. A high process turnover may indicate a problem. OSS-type processes usually have a much higher turnover due to the nature of the UNIX-like environment.
CIDs are a MEASURE resource used to contain counters for measurements. Free CIDs must be available to support current and additional measurements.
The CPU queue is reported as Instant, or what is in the queue right now, and Average, which is the queue over the Interval period. The Instant queue is a whole number of processes while the Average is a decimal value. The Average memory queue is only available (i.e. have a non-zero value) on older platforms.
I/Os per second indicate the gross total disk I/O activity at the CPU level. The physical I/Os plus the I/Os satisfied from cache equal the total I/Os. The percent of cache hits indicates the overall effectiveness of the disk cache. High levels of I/Os with a low cache hit percentage may indicate insufficient cache allocated to disk.